
Stop Wasting 20+ Hours Per Week on Manual Reports
Dashboards show you the ‘what’—Aira shows you the ‘why’. Our intelligent AI data analyst speaks your language, highlights meaningful insights, and uncovers the questions that drive action.
Are You Drowning in Data But Starving for Insights?
Spending Hours Creating Basic Reports
Your team wastes 20+ hours weekly wrestling with Excel, SQL queries, and manual chart creation instead of analyzing what the data actually means.
Data Scattered Across Multiple Systems
Your valuable insights are trapped in different databases, warehouses, and tools. Getting a complete picture feels impossible.
Missing Critical Business Opportunities
By the time you manually compile reports, market opportunities have passed. Your competitors are moving faster with real-time insights.
Executive Pressure for Faster Decisions
Leadership demands instant answers, but your current process takes days or weeks to deliver actionable insights.
Solution
Introducing Grafieks: AI-Powered Business Intelligence Platform
10x Faster Report Creation
What used to take 20 hours now takes less than 1 minute. Our AI data analyst instantly connects to your data sources and generates professional reports with minimal manual intervention.
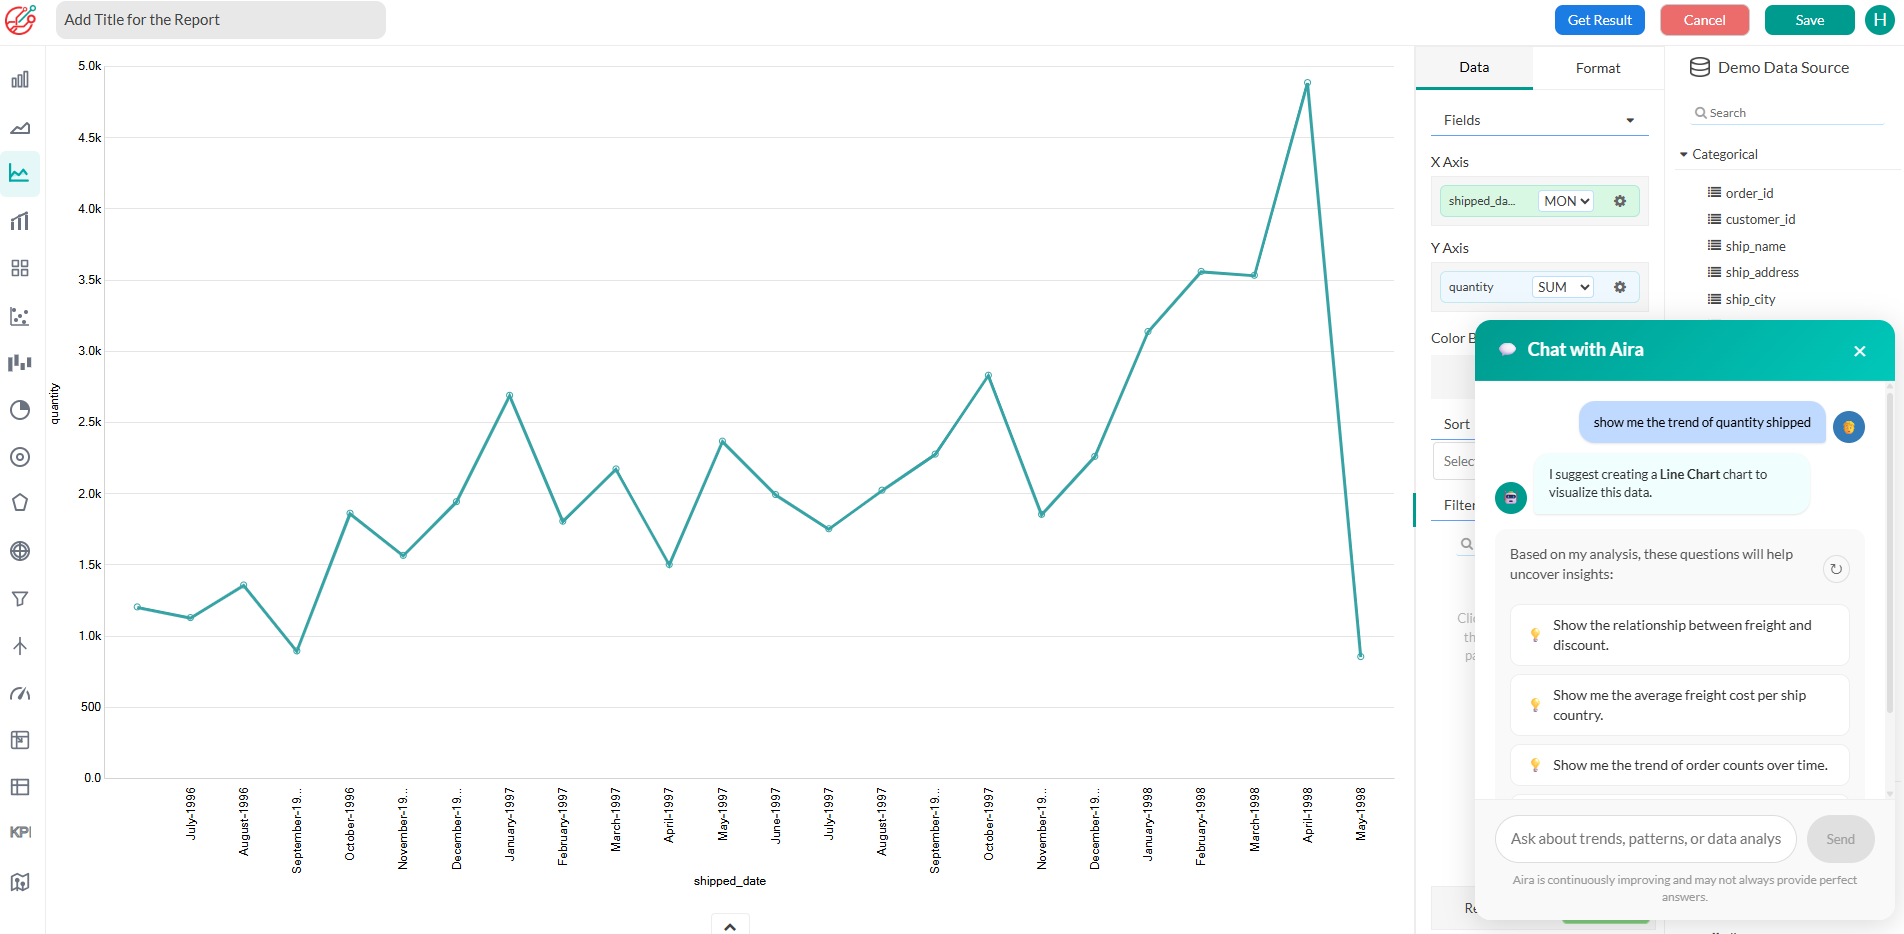
AI Suggests What You Should Ask
Never stare at data again. Our AI analyzes your data and suggests the most important questions you should be asking.

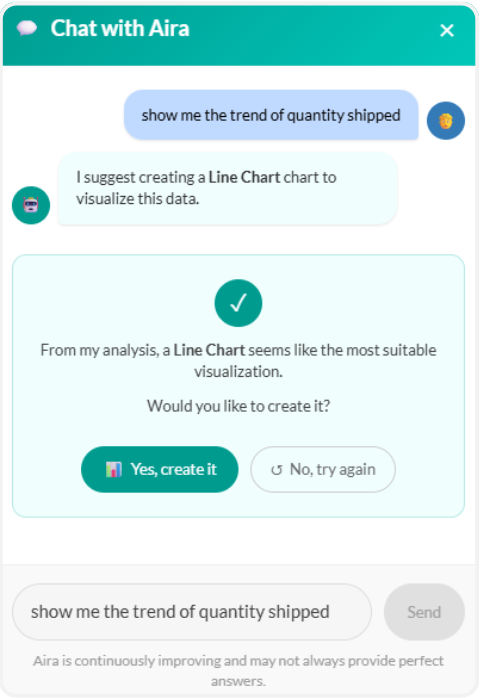
Talk to Your Data in Plain English
"Show me sales trends for Q4" - just type what you want to see and watch as professional charts appear instantly. No SQL required.
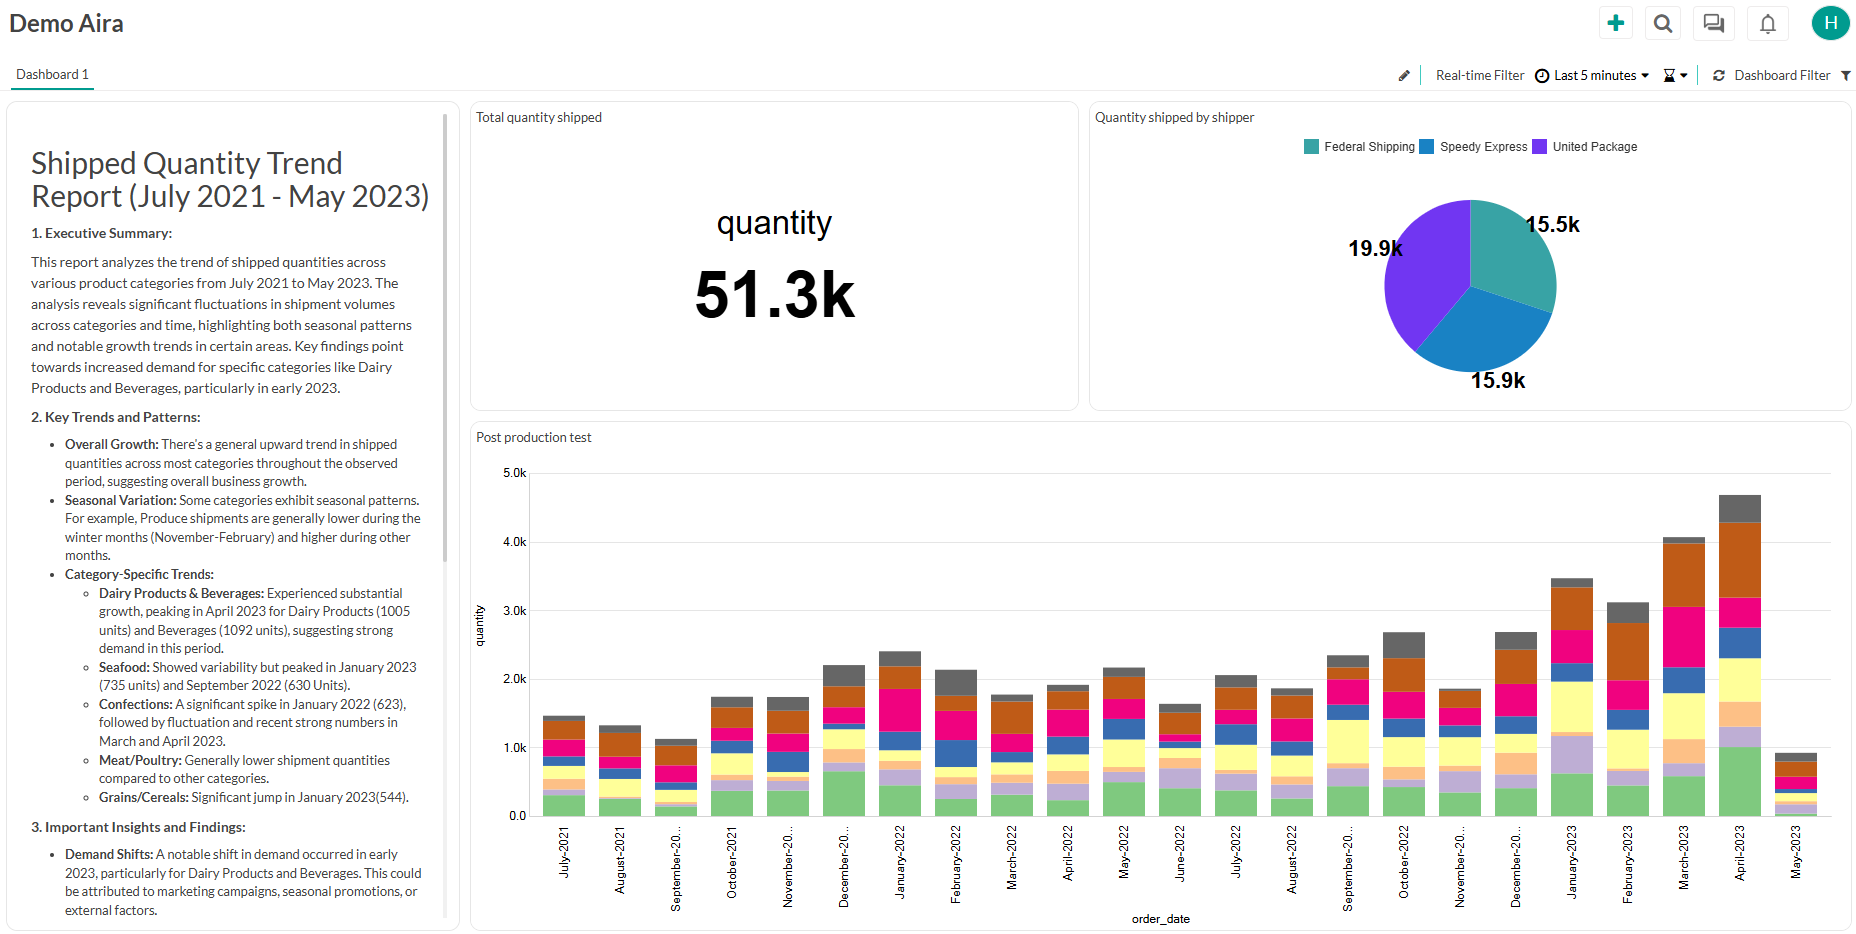
Automatic Insights & Summaries
AI doesn't just show you charts - it tells you what they mean, highlights anomalies, and suggests actions to take.
Everything You Need to Transform Data Into Decisions
Universal Data Connectors
Connect to any database, data warehouse, or dbt project in seconds. Real-time streaming support included.
Drag & Drop Report Builder
No coding required. Build professional reports by simply dragging and dropping elements.
AI-Powered Chart Recommendations
AI analyzes your data and automatically suggests the best visualization types for maximum impact.
Natural Language Queries
Type questions in plain English: "Show me top customers by revenue this quarter" and get instant charts.
Smart Data Catalog
Connect to any database, data warehouse, or dbt project in seconds. Real-time streaming support included.
Interactive Dashboards
Create stunning, real-time dashboards that update automatically as your data changes.
Automated Insights & Summaries
AI generates executive summaries highlighting key trends, outliers, and recommended actions.
Custom Fields & dbt Integration
Type questions in plain English: "Show me top customers by revenue this quarter" and get instant charts.
Transform Data into Strategic Advantage
Harness the power of AI to convert raw data into intelligent visualizations that drive business strategy. Our platform empowers leaders to identify trends, uncover opportunities, and make data-backed decisions—faster and with greater confidence.
Drop in your details, and a Sales Executive will reach out to explore how Grafieks can deliver value to your organization.